Equipment needed
Not shown in the pictures
- one analog adapter and one USB-Link
- Collection of red/black wires
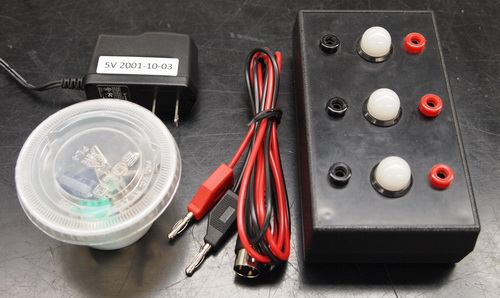
Shown in the picture on top
- 5 volt power adapter
- 3-bulb box
- 1 Voltage probe
- a plastic cup with various elements in it (the cup is in the RC lab drawer)
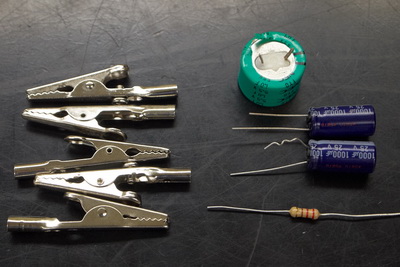
Inside the plastic cup, you will find the following elements shown in the bottom picture
- several alligator clips
- a green 1F capacitor
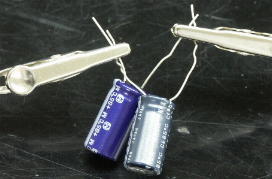
- two blue 1000 microF capasitors
- One 220 and one 2200 Ohm resistors (the ones with color bands), please ask your instructor to help you identify the one you need..
"Negative" terminal of the blue capacitor
Make sure you connect the capacitor so that the lead that the "arrows" point to is the NEGATIVE power side.

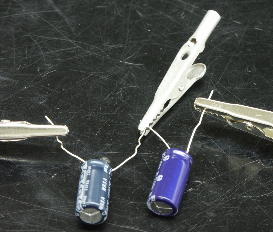
Connecting capacitors in series or parallel
Left image: Just use a spare alligator clip between them to create a series circuit (notice that the middle alligator clip is not connected to anything - it just clips the two capacitor leads together).
Right image: Connecting in parallel is pretty easy .. just put both leads together into each of the side alligator clamps.
How can I know if DataStudio is recording data?
The DataStudio experiment file is set with a "trigger" - when you click the START button, DS will wait for a particular condition to be reached, and then it will record data. In this case, once the voltage drops below a certain value, then the data will be recorded and displayed on the graph.
When you click the START button, when using this trigger ... you'll see a flickering datapoint showing up on the Voltage axis ... that point should be at about 4.7 volts. As soon as the voltage drops below the 4.7 volts, the curve will light up with the data that is being recorded.
What if the trigger condition doesn't get met?
If you see that flickering point drop vertically down to the zero, without the graph filling out horiztonally, then it means the trigger condition wasn't met - and when you click STOP, you should get that error dialog! Follow the steps in the next box, and you should be able to get a graph like the box after that.
Now, the value coded into the experiment file should work fine for our 5 volt system, but, in case the voltage never starts out above that trigger ... what will DataStudio do? It will give you this error message (after you click the STOP) button.

Getting the right selection with the Smart Tool
During some of the later sections, we will be making selections with the smart tool - it has a nice feature that will tell us if we are "on" a datapoint or not - it will turn the data numbers RED!
Look at this example (actually from a task we will do later) - the initial corner of the smart tool is actually on a data point (upper left) - the numbers are red. But, when we dragged out the Delta Tool, we are not actually on a datapoint (which is visually obvious, but the intent here is to show the delta numbers are not red!).
Area under the curve = "integral" of voltage vs time
Selecting the Statistics pulldown, you can select AREA and it will shade in the area under the curve and give you a data item in the legend.
To keep the mystery alive, the values of the innocent have been
disguised for their protection!
Finding the Exponential Fit for the data run
Select the FIT button and choose NATURAL EXPONENTIAL FIT - a curve will be added to the graph along with a results box.