General Equipment
- 2 transformers
- 1 decade resistance box (switches)
- 2 sets of voltage probes, analog adapters and USB Links
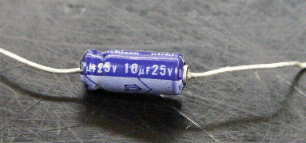
- 1 10 microfarad capacitor (small blue)
- assorted wires and two alligator clips
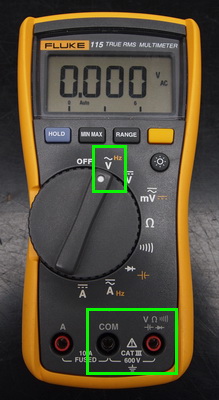
- 1 Multi-meter (not shown)
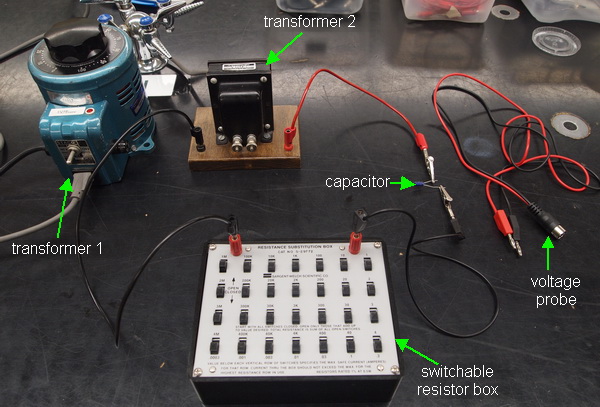
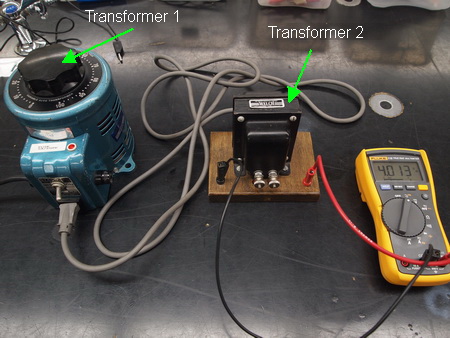
Transformers preparation
Please note your transformers 1 and 2 may look slightly different
- Flip the switch of transformer 1 to OFF
- Turn the dial on transformer 1 all the way to zero
- plug transformer 1 in the the electricity outlet on the side of your lab station
- Plug transformer 2 into transformer 1
- Plug a multimeter to transformer 2 (refer to the bottom picture for multimeter configuration)
- Flip on Transformer 1
- Turn the dial on transformer 1 and watch the reading on the multimeter, stop when you have a reading around 4V. Never exceed 4.5V.
- Leave the dial untouched for the experiment.
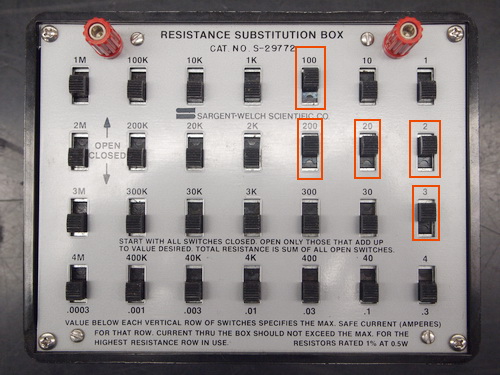
There are many switches on the resistor box. When a switch is flipped up, the corresponding resistor is engaged; if it's flipped down, the resistor is disengaged.
In the pictures to the right, the switches of 100, 200, 20, 2 and 3 are flipped up, which means the resistance of the box is now 100+200+20+2+3=325Ohms.
10 microfarad capacitor
Read the capacitor label, and make sure it is the 10 microfarad. Your capacitor may look different.
Circuit A - Measuring time (with Smart/Delta tools) to get phase
We have zoomed in to see the two curves rising across the axis. Start the SMART TOOL on the leftmost curve, and the pull the DELTA tool to stretch over to the rightmost curve. [It is not important what the vertical heights are .. we only want the time reading horizontally.]
In this case, the time difference between the two graphs is 0.00228 seconds. If we compare that to the total time period of 0.01666 seconds, we find this time difference to be about 13.9 % of the whole period. If one period would be 360 degrees, then this would be an angle of about 49 degrees (seems reasonable - our angles should be between 0 and 90).
Note : we just need to record our times in Excel - the sample calculation above is already coded in, and Excel will show us a column with angles.
What if one of the voltage curves is really jagged?
Occasionally, we will have very low voltage curves, and they might be quite jagged. How do we determine where the curve crosses the axis? ... See the next help box!
Well, in these rare cases ... let's cheat! Let's let Data Studio curve fit a sine curve!
Make sure that particular channel on the graph is selected (click on that channel in the legend of the graph and it will be highlighted yellow). Click the FITS button and choose Sine fit. Voila - we have a "cleaner" version of the jagged curve.
And notice what the Frequency for the fit equation is ... just about 60 Hz - excellent!
But, how do we use that ... move alway all the various legends/fit boxes and zoom in again - this time, we select from the fit curve (purple) to the other curve (green). This would give us a slightly more accurate reading.
Note: We should ONLY need to do this when the curves are really jagged - other times, it would be reasonable to just use the regular data (and faster!).