How can I choose to hide or show a particular data run on a graph?
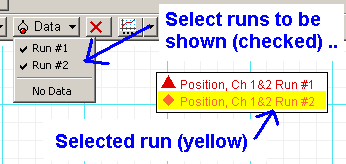
- Go to the DATA menu item
- Check or uncheck the runs you want to show or hide.
- On the graph, the legend will show the runs, and the yellow is the "selected" run
Can I change the name of the run? Sure!
- Go to the DATA panel (upper left)
- Click once on the run you want to rename, wait a second, then click again (this should highlight the name, and put it into "edit" mode). Type in the new name.
- When you press ENTER, you should get a dialog box - say YES .. then each data set from that particular run will be reanmed.

How can I delete a particular run?
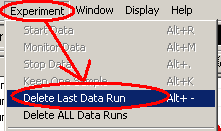
If you want to delete that LAST run only ... use the EXPERIMENT menu
option of DELETE LAST DATA RUN.
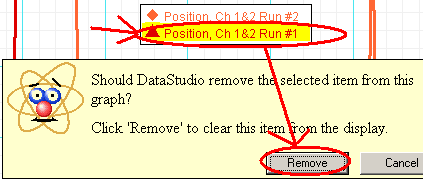
But, if it is one of the other runs, you'll need to select it (one quick way is to use the onscreen legend) and then press the DELETE button on the keyboard. You'll get the prompt about removing the data run - click REMOVE.
How can I annotate a particular curve?
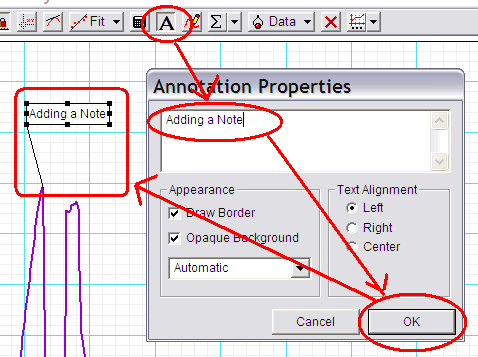
Click the A button on the toolbar, and the click somewhere on the graph.
This will open a box where you can type in a note.
It then leaves you a "floating" note box, with a 'string' attached to it ... you can use the mouse to move that around, and can click on the end of the 'string' to move it so that it can touch a curve (as shown to the right).
How can I get numerical information about different points in a data set? Use the SMART TOOL feature.
The Smart Tool is the little "XY" graph icon - if you click it, a set of crosshairs with numbers will show up in the graph.
![]()
Why does the Smart Tool "lock onto" different data points?
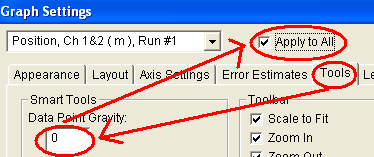
The Smart Tool has a setting called "Data Point Gravity" that tells it to lock onto a data point if it comes close. This is almost always something we want to turn OFF! Most of the experiment files should have this turned off, but it would be a good idea to check. If you right- click on a graph, you'll get a popup box - the last item is SETTINGS - select that, and then follow the steps shown here. (Setting the gravity to zero turns it "off". Apply to all makes sure that all current and future graphs in this experiment file will have this setting.)

What does the Smart Tool show me?
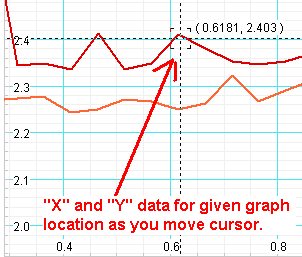
As the Smart Tool cursor is moved around the graph, the "X" and "Y" values for that point are shown. (Note, these are the values where the cursor is - make sure you are actually ON the point you want to measure when you record the values.
In the case of two graphs in the same display - if you a smart tool into each graph, the "X" values will stay locked together.
What MORE does the Smart Tool show me? (delta)
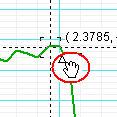
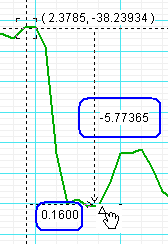
Another feature of the smart tool - you can drag one of the little corners of that 'cross hair' square in the middle - and drag open a rectangle. [First image shows moving the mouse to the lower right corner and getting the "delta hand" mouse icon. The second image shows the dragged-open rectangle.]
This gives you the relative "X" and "Y" values for that rectangle. This can be very useful if we need to measure from a "zero" value of a force to the actual reading.
Once you have the rectangle opened ... you can grab any of the four sides of the rectangle and adjust as necessary (or grab the corners also)
Can I show "statistics" on a data run?
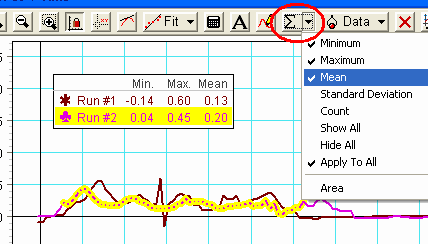
Select one of the data runs (in this case Run#2) and click the "summation" icon on the menu bar. You can select which statistical information you want to display. It will be displayed, as shown, in the legend box.
If you choose "apply to all" - you'll see all the runs have the stats showing (as this example shows).
